presentazione standard di powerpoint - kairos … · intervento: gianluca bordin standardizzazione...
TRANSCRIPT
Intervento:
Gianluca Bordin
STANDARDIZZAZIONE DI UNA BALANCED SCORECARD DI GRUPPO E INTEGRAZIONE DEL SISTEMA PREMIANTE DEL MANAGEMENT ATTRAVERSO L’ADOZIAIONE DEI RELATIVI KPI
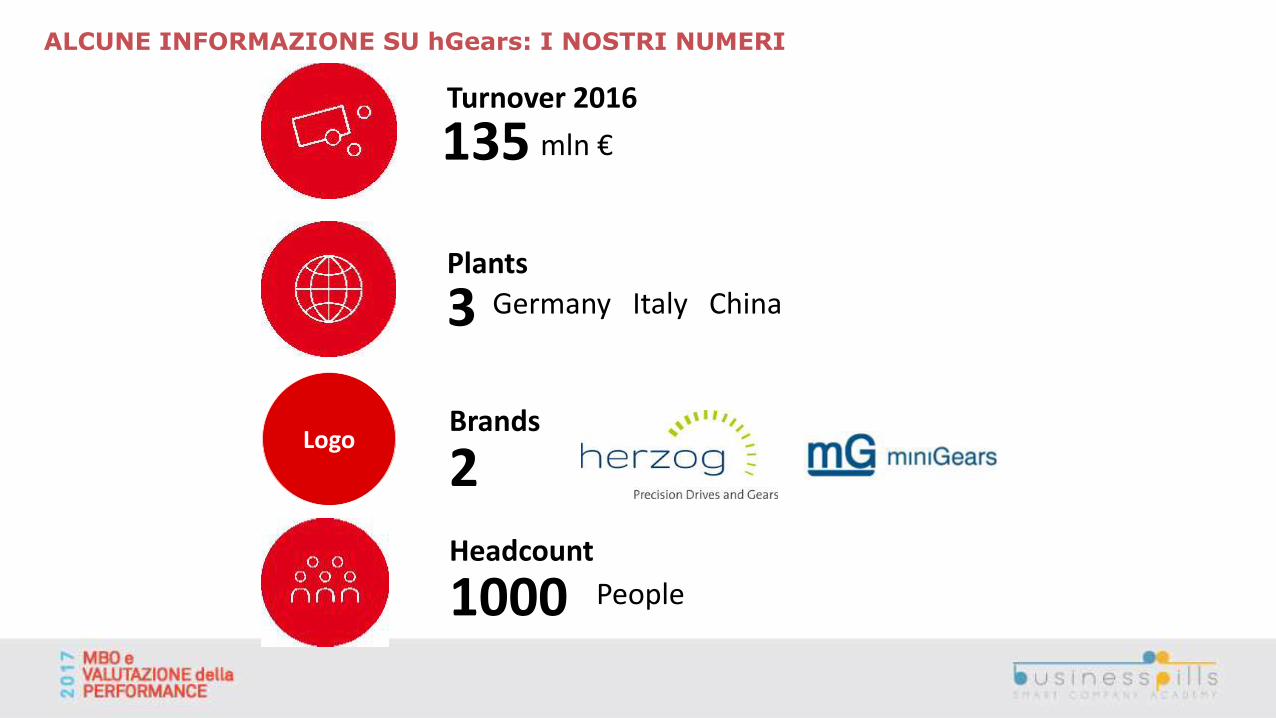
ALCUNE INFORMAZIONE SU hGears: I NOSTRI NUMERI
1000 Headcount
3 Germany Italy China
135
Turnover 2016
People
Plants
mln €
Logo Brands
2
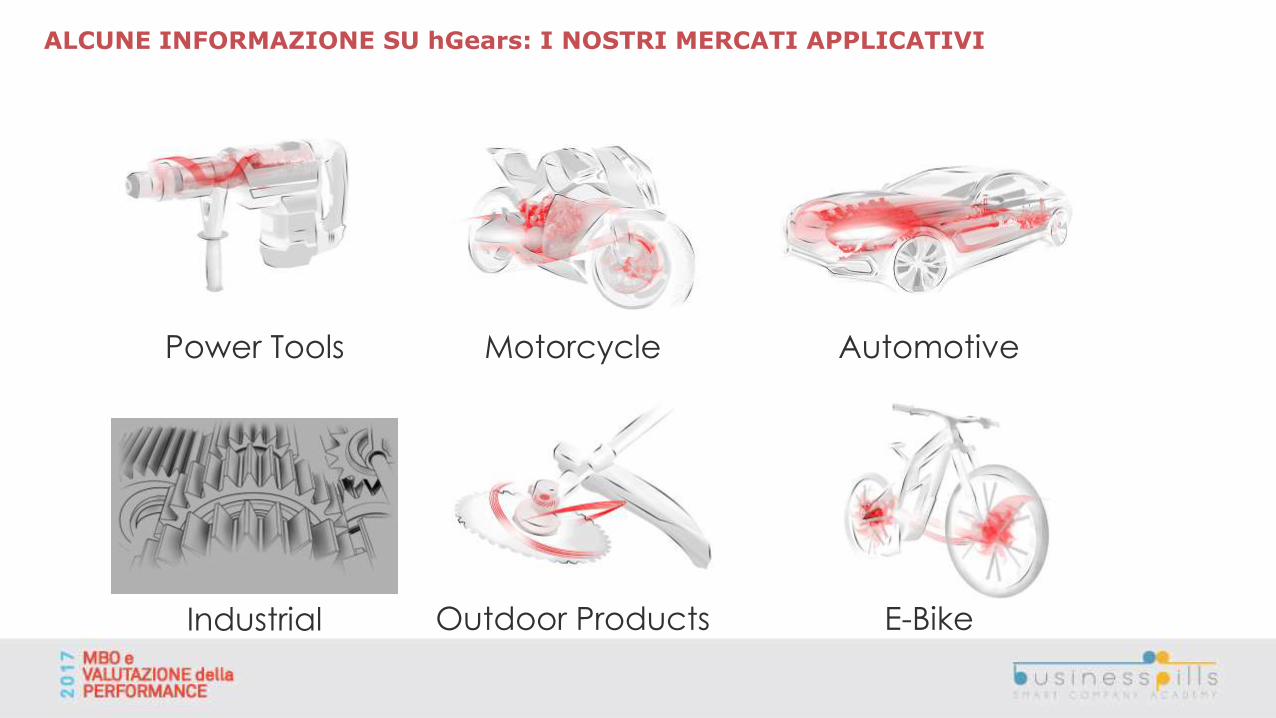
ALCUNE INFORMAZIONE SU hGears: I NOSTRI MERCATI APPLICATIVI
Power Tools Motorcycle Automotive
Industrial Outdoor Products E-Bike
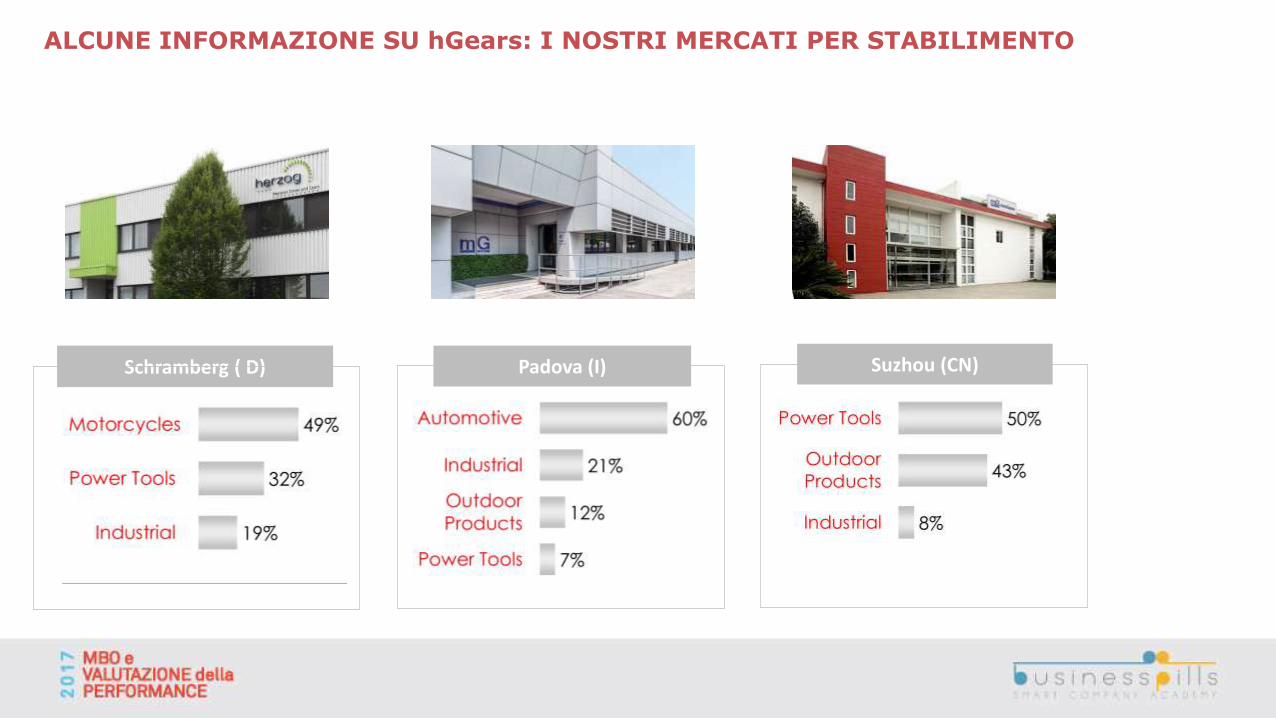
ALCUNE INFORMAZIONE SU hGears: I NOSTRI MERCATI PER STABILIMENTO
Schramberg ( D) Suzhou (CN) Padova (I)
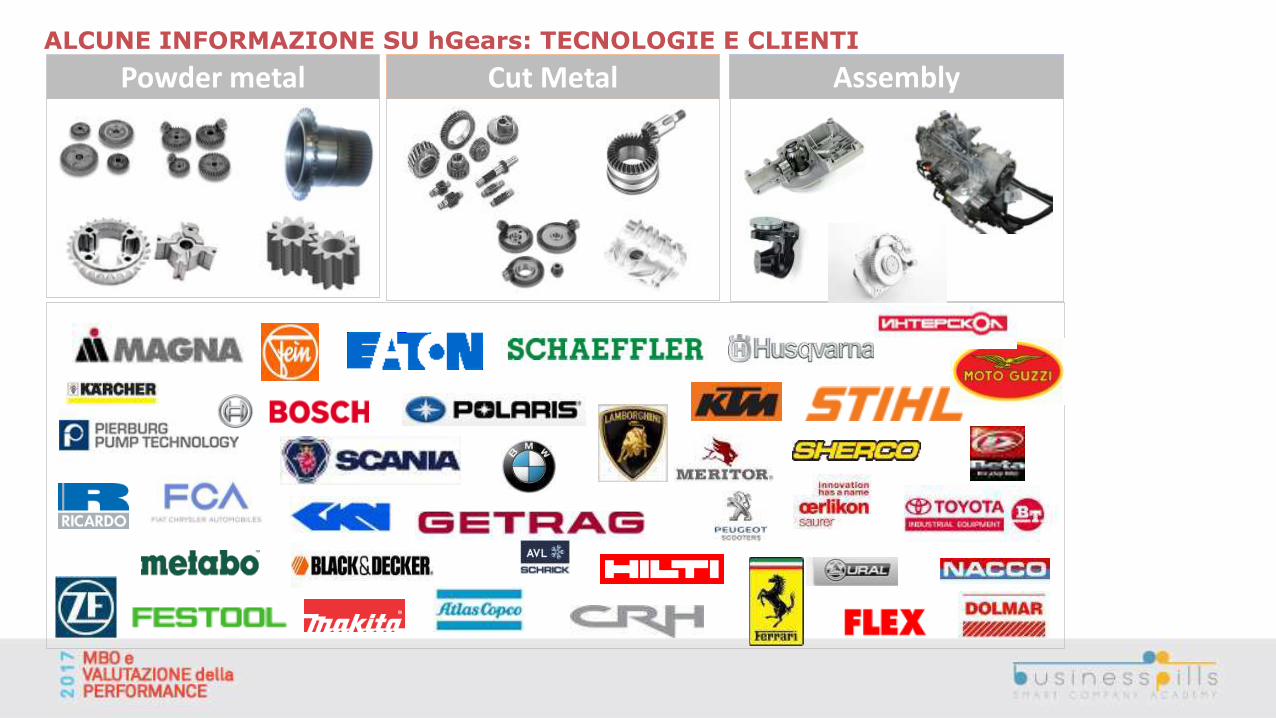
ALCUNE INFORMAZIONE SU hGears: TECNOLOGIE E CLIENTI
Powder metal Cut Metal Assembly
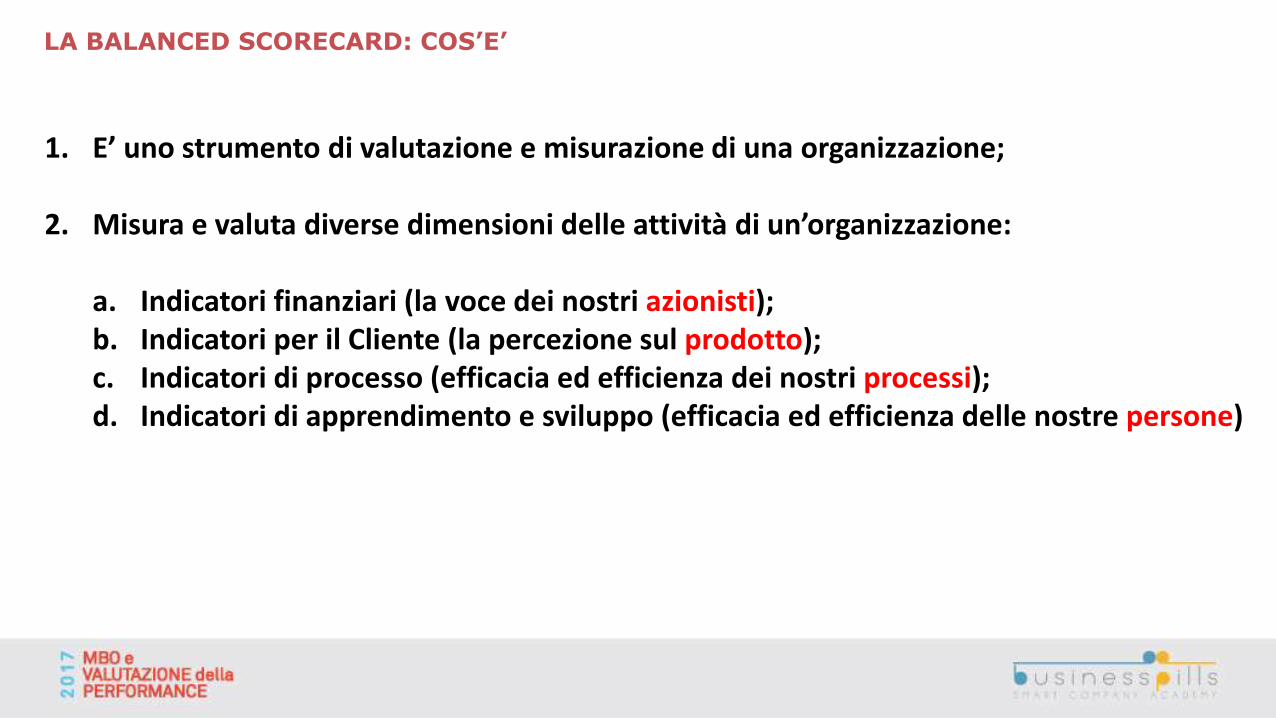
LA BALANCED SCORECARD: COS’E’
1. E’ uno strumento di valutazione e misurazione di una organizzazione;
2. Misura e valuta diverse dimensioni delle attività di un’organizzazione:
a. Indicatori finanziari (la voce dei nostri azionisti); b. Indicatori per il Cliente (la percezione sul prodotto); c. Indicatori di processo (efficacia ed efficienza dei nostri processi); d. Indicatori di apprendimento e sviluppo (efficacia ed efficienza delle nostre persone)
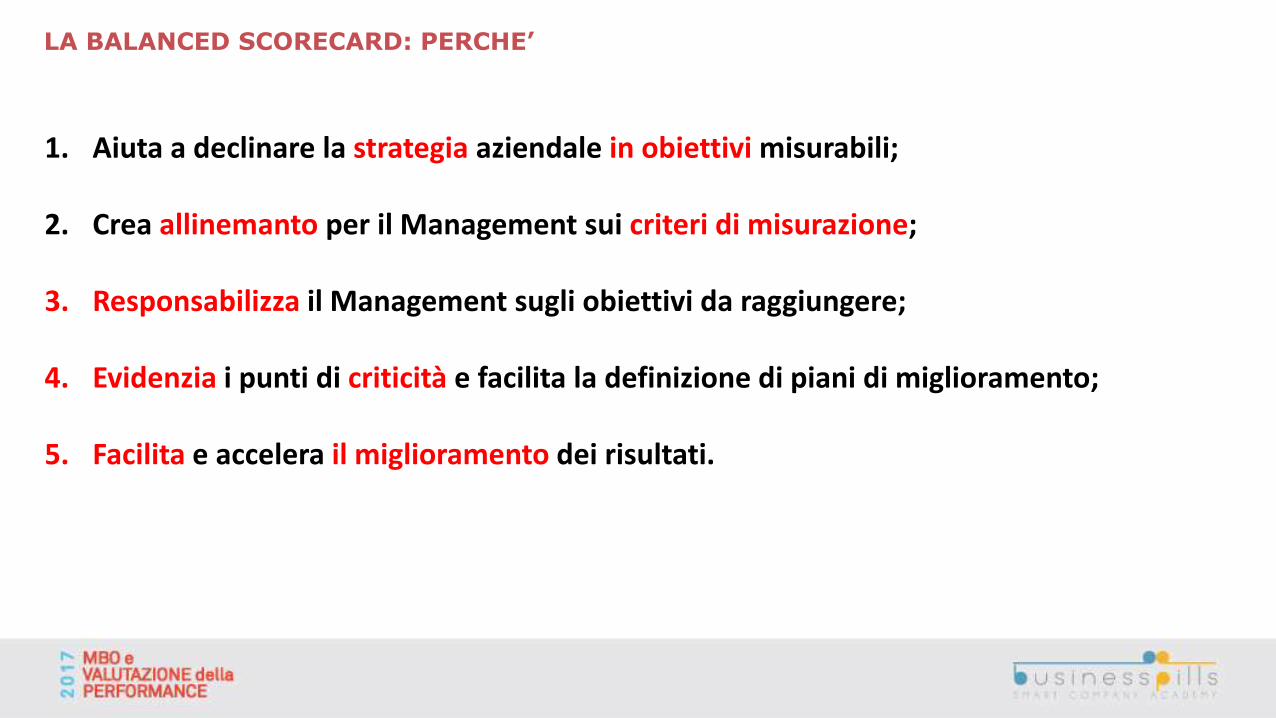
LA BALANCED SCORECARD: PERCHE’
1. Aiuta a declinare la strategia aziendale in obiettivi misurabili;
2. Crea allinemanto per il Management sui criteri di misurazione;
3. Responsabilizza il Management sugli obiettivi da raggiungere;
4. Evidenzia i punti di criticità e facilita la definizione di piani di miglioramento;
5. Facilita e accelera il miglioramento dei risultati.
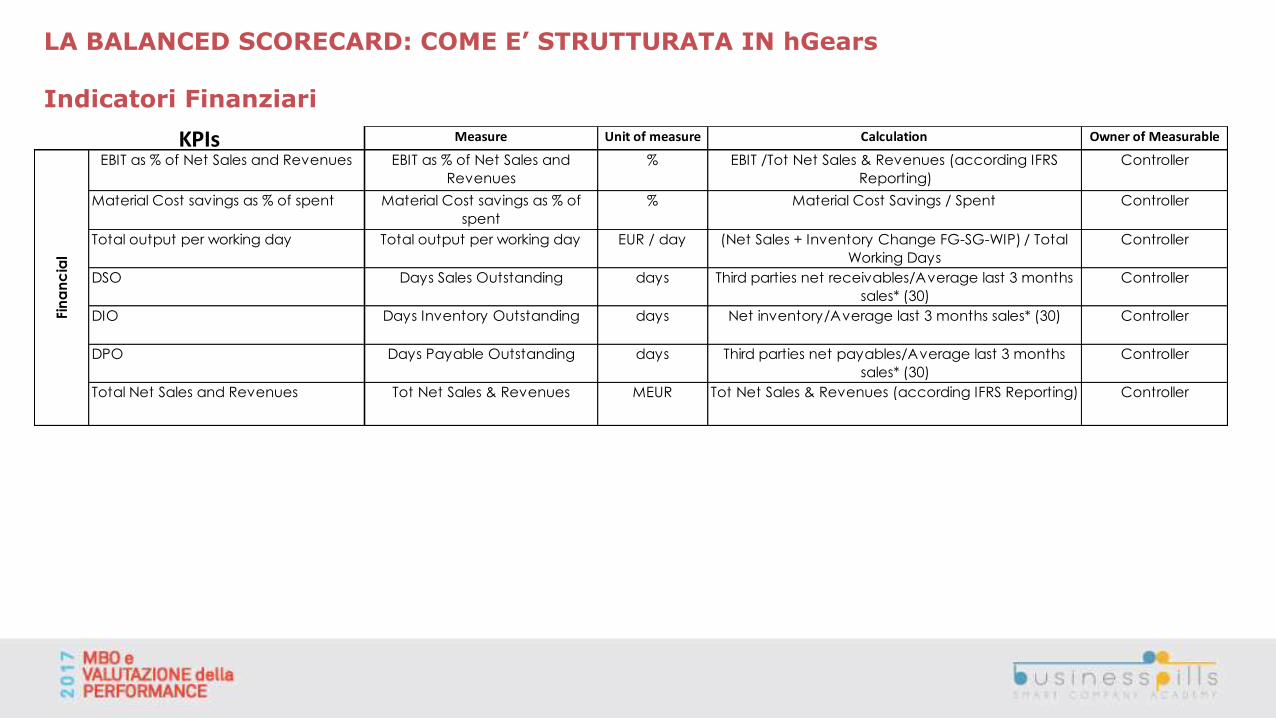
LA BALANCED SCORECARD: COME E’ STRUTTURATA IN hGears Indicatori Finanziari
Measure Unit of measure Calculation Owner of Measurable
Material Cost savings as % of spent
Total output per working day
DSO
DIO
DPO
Total Net Sales and Revenues Tot Net Sales & Revenues MEUR Tot Net Sales & Revenues (according IFRS Reporting) Controller
Days Inventory Outstanding days Net inventory/Average last 3 months sales* (30) Controller
Days Payable Outstanding days Third parties net payables/Average last 3 months
sales* (30)
Controller
Total output per working day EUR / day (Net Sales + Inventory Change FG-SG-WIP) / Total
Working Days
Controller
Days Sales Outstanding days Third parties net receivables/Average last 3 months
sales* (30)
Controller
EBIT as % of Net Sales and
Revenues
% EBIT /Tot Net Sales & Revenues (according IFRS
Reporting)
Controller
Material Cost savings as % of
spent
% Material Cost Savings / Spent Controller
Fin
an
cia
l
KPIsEBIT as % of Net Sales and Revenues
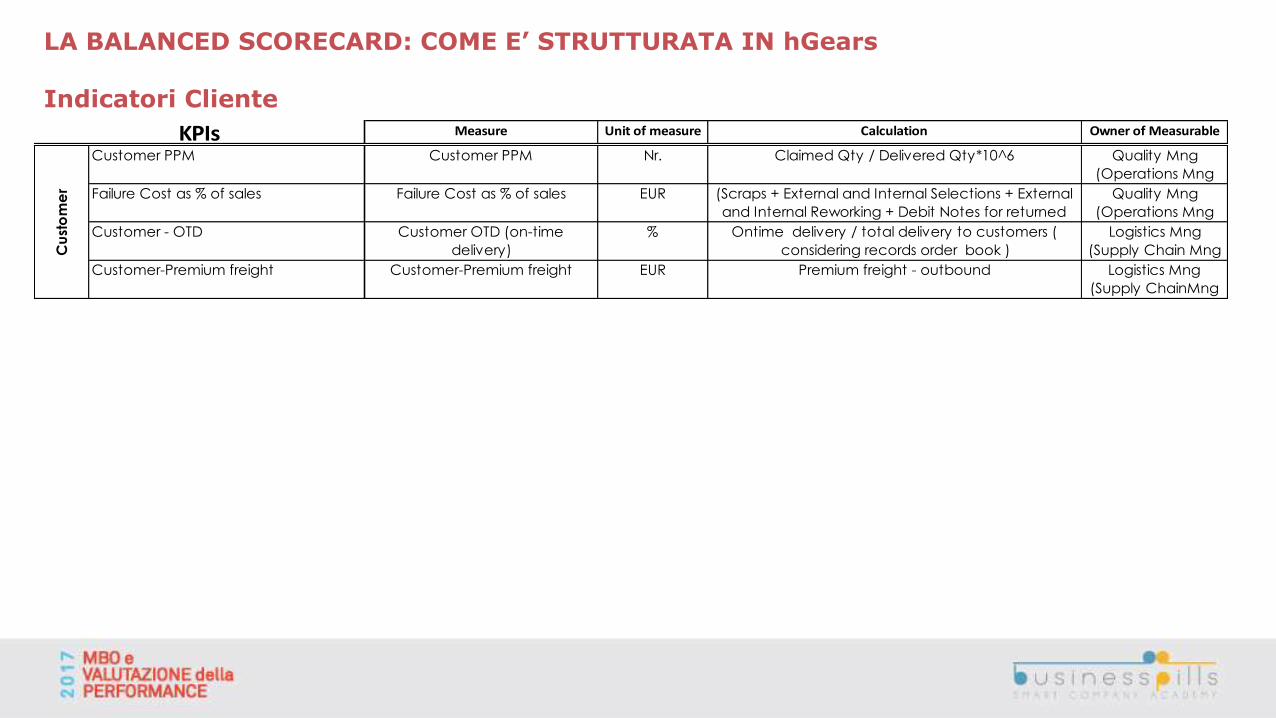
LA BALANCED SCORECARD: COME E’ STRUTTURATA IN hGears Indicatori Cliente
Measure Unit of measure Calculation Owner of MeasurableKPIsCustomer PPM
Failure Cost as % of sales
Customer - OTD
Customer-Premium freight Customer-Premium freight EUR Premium freight - outbound Logistics Mng
(Supply ChainMng
Supervisor)
Failure Cost as % of sales EUR (Scraps + External and Internal Selections + External
and Internal Reworking + Debit Notes for returned
parts from field + Adm. Costs) /Tot Net Sales
Quality Mng
(Operations Mng
Supervisor)Customer OTD (on-time
delivery)
% Ontime delivery / total delivery to customers (
considering records order book )
Logistics Mng
(Supply Chain Mng
Supervisor)
Customer PPM Nr. Claimed Qty / Delivered Qty*10^6 Quality Mng
(Operations Mng
Supervisor)
Cu
sto
me
r
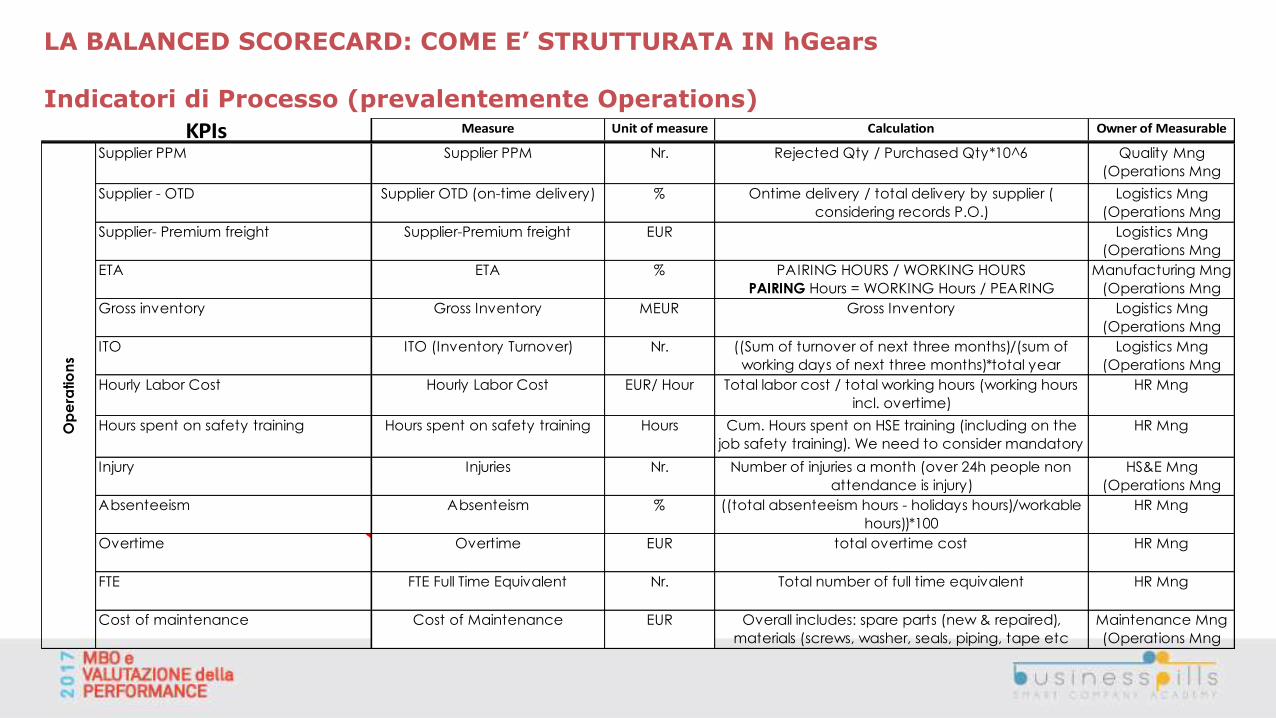
LA BALANCED SCORECARD: COME E’ STRUTTURATA IN hGears Indicatori di Processo (prevalentemente Operations)
Measure Unit of measure Calculation Owner of MeasurableKPIsSupplier PPM
Supplier - OTD
Supplier- Premium freight
ETA
Gross inventory
ITO
Hourly Labor Cost
Hours spent on safety training
Injury
Absenteeism
Overtime
FTE
Cost of maintenance
FTE Full Time Equivalent Nr. Total number of full time equivalent HR Mng
Cost of Maintenance EUR Overall includes: spare parts (new & repaired),
materials (screws, washer, seals, piping, tape etc
etc) , contract for preventive maintenance,
Maintenance Mng
(Operations Mng
Supervisor)
Absenteism % ((total absenteeism hours - holidays hours)/workable
hours))*100
HR Mng
Overtime EUR total overtime cost HR Mng
Hours spent on safety training Hours Cum. Hours spent on HSE training (including on the
job safety training). We need to consider mandatory
and no-mandatory training including on the job and
HR Mng
Injuries Nr. Number of injuries a month (over 24h people non
attendance is injury)
HS&E Mng
(Operations Mng
Supervisor)
ITO (Inventory Turnover) Nr. ((Sum of turnover of next three months)/(sum of
working days of next three months)*total year
working days)/Gross Inventory
Logistics Mng
(Operations Mng
Supervisor)Hourly Labor Cost EUR/ Hour Total labor cost / total working hours (working hours
incl. overtime)
HR Mng
ETA % PAIRING HOURS / WORKING HOURS
PAIRING Hours = WORKING Hours / PEARING
PAIRING = Nr. of Machines assigned to an operator
Manufacturing Mng
(Operations Mng
Supervisor)Gross Inventory MEUR Gross Inventory Logistics Mng
(Operations Mng
Supervisor)
Supplier OTD (on-time delivery) % Ontime delivery / total delivery by supplier (
considering records P.O.)
Logistics Mng
(Operations Mng
Supervisor)Supplier-Premium freight EUR Logistics Mng
(Operations Mng
Supervisor)
Supplier PPM Nr. Rejected Qty / Purchased Qty*10^6 Quality Mng
(Operations Mng
Supervisor)
Op
era
tio
ns
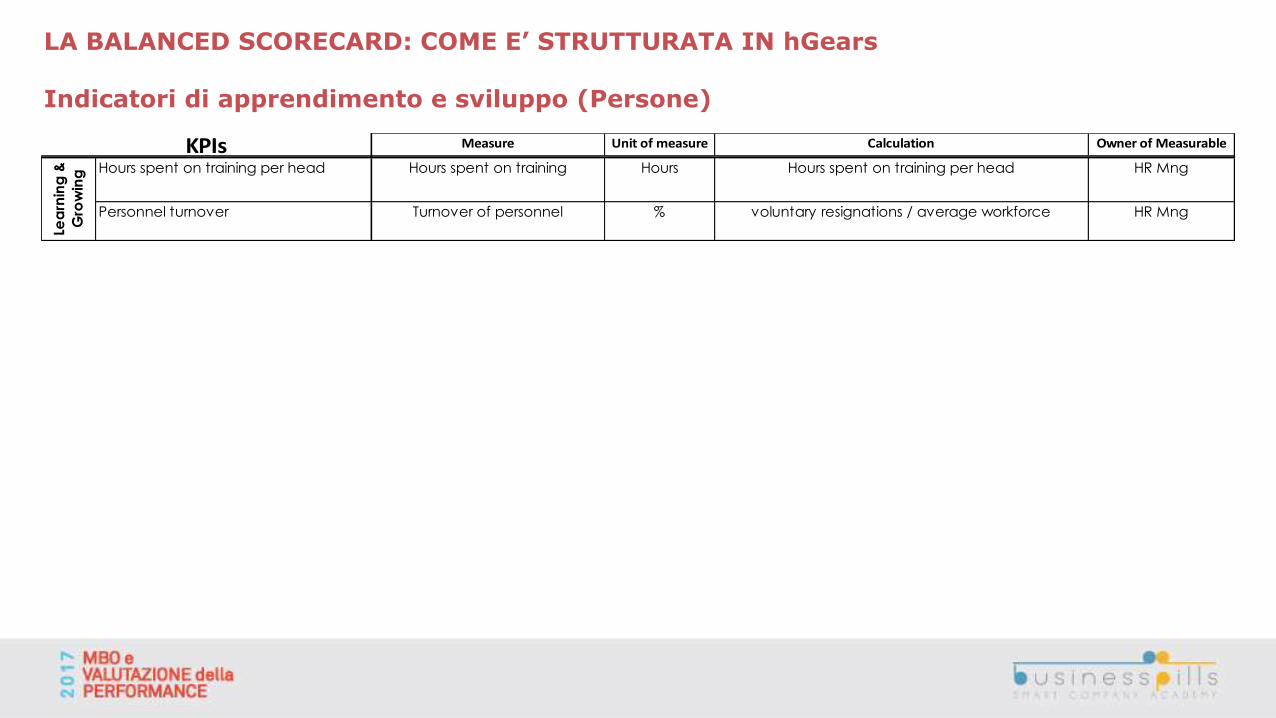
LA BALANCED SCORECARD: COME E’ STRUTTURATA IN hGears Indicatori di apprendimento e sviluppo (Persone)
Measure Unit of measure Calculation Owner of MeasurableKPIsHours spent on training per head
Personnel turnover
Hours spent on training Hours Hours spent on training per head HR Mng
Turnover of personnel % voluntary resignations / average workforce HR Mng
Lea
rnin
g &
Gro
win
g
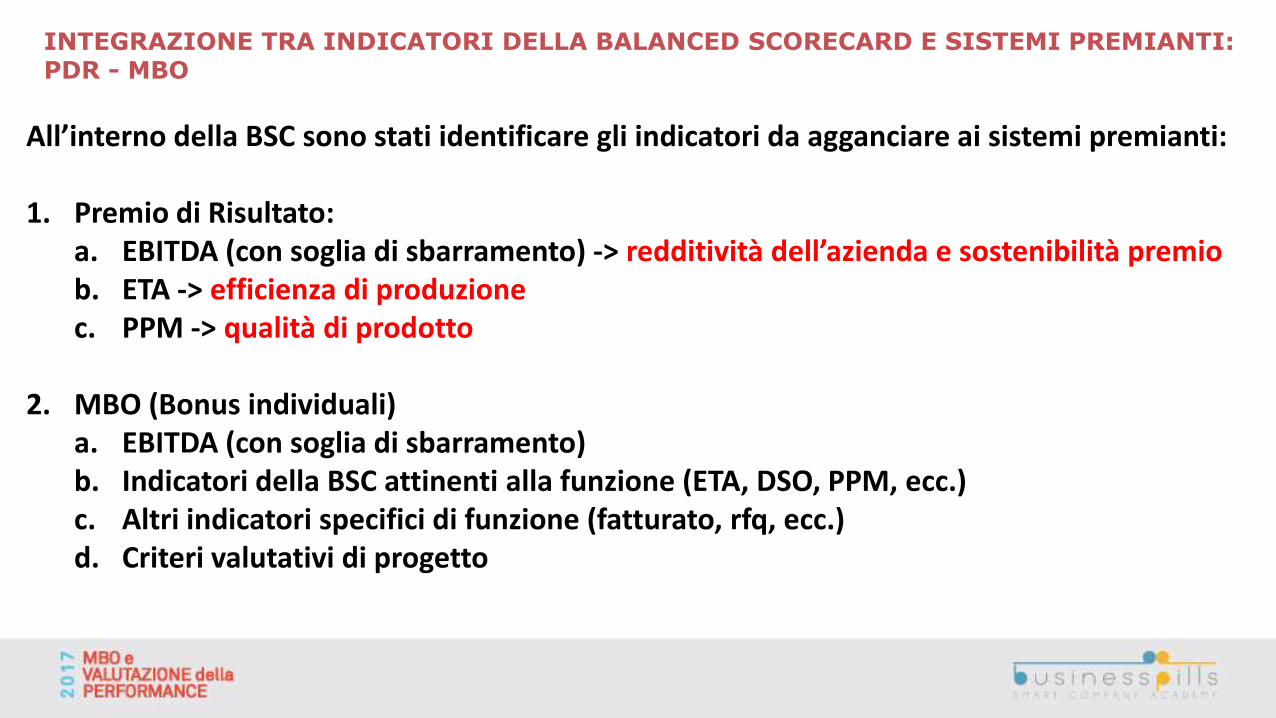
INTEGRAZIONE TRA INDICATORI DELLA BALANCED SCORECARD E SISTEMI PREMIANTI: PDR - MBO
All’interno della BSC sono stati identificare gli indicatori da agganciare ai sistemi premianti: 1. Premio di Risultato:
a. EBITDA (con soglia di sbarramento) -> redditività dell’azienda e sostenibilità premio b. ETA -> efficienza di produzione c. PPM -> qualità di prodotto
2. MBO (Bonus individuali)
a. EBITDA (con soglia di sbarramento) b. Indicatori della BSC attinenti alla funzione (ETA, DSO, PPM, ecc.) c. Altri indicatori specifici di funzione (fatturato, rfq, ecc.) d. Criteri valutativi di progetto
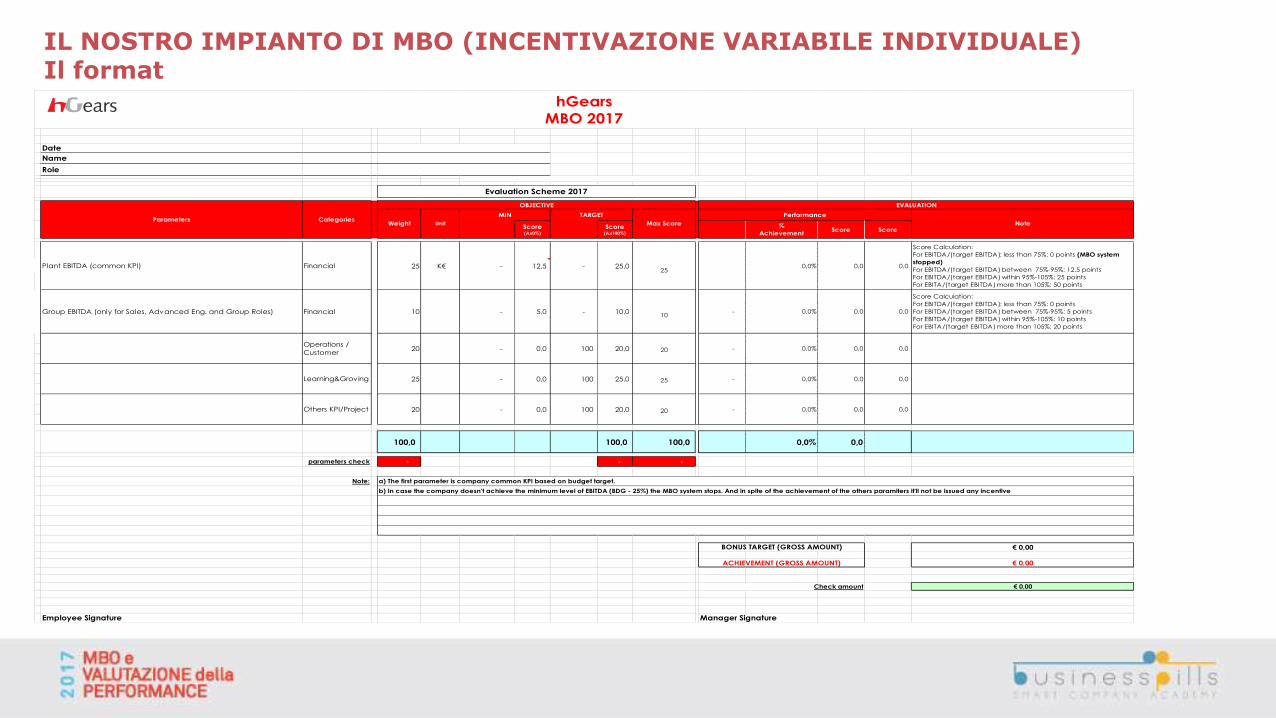
IL NOSTRO IMPIANTO DI MBO (INCENTIVAZIONE VARIABILE INDIVIDUALE) Il format
Date
Name
Role
OBJECTIVE EVALUATION
Score(Ax0%)
Score(Ax100%)
%
AchievementScore Score
25 K€ - 12,5 - 25,0 0,0% 0,0 0,0
10 - 5,0 - 10,0 - 0,0% 0,0 0,0
20 - 0,0 100 20,0 - 0,0% 0,0 0,0
25 - 0,0 100 25,0 - 0,0% 0,0 0,0
20 - 0,0 100 20,0 - 0,0% 0,0 0,0
100,0 100,0 100,0 0,0% 0,0
parameters check - - -
Note:
€ 0,00
€ 0,00
€ 0,00
Employee Signature Manager Signature
Check amount
20
a) The first parameter is company common KPI based on budget target.
b) In case the company doesn't achieve the minimum level of EBITDA (BDG - 25%) the MBO system stops. And in spite of the achievement of the others paramiters it'll not be issued any incentive
BONUS TARGET (GROSS AMOUNT)
ACHIEVEMENT (GROSS AMOUNT)
Others KPI/Project
Score Calculation:
For EBITDA/(target EBITDA): less than 75%: 0 points
For EBITDA/(target EBITDA) between 75%-95%: 5 points
For EBITDA/(target EBITDA) within 95%-105%: 10 points
For EBITA/(target EBITDA) more than 105%: 20 points
20
Financial
Operations /
Customer
Categories
Financial
Group EBITDA (only for Sales, Advanced Eng. and Group Roles)10
hGears
MBO 2017
Learning&Groving 25
Evaluation Scheme 2017
Max Score
Performance
Note
Plant EBITDA (common KPI)25
Score Calculation:
For EBITDA/(target EBITDA): less than 75%: 0 points (MBO system
stopped)
For EBITDA/(target EBITDA) between 75%-95%: 12.5 points
For EBITDA/(target EBITDA) within 95%-105%: 25 points
For EBITA/(target EBITDA) more than 105%: 50 points
ParametersWeight Unit
MIN TARGET
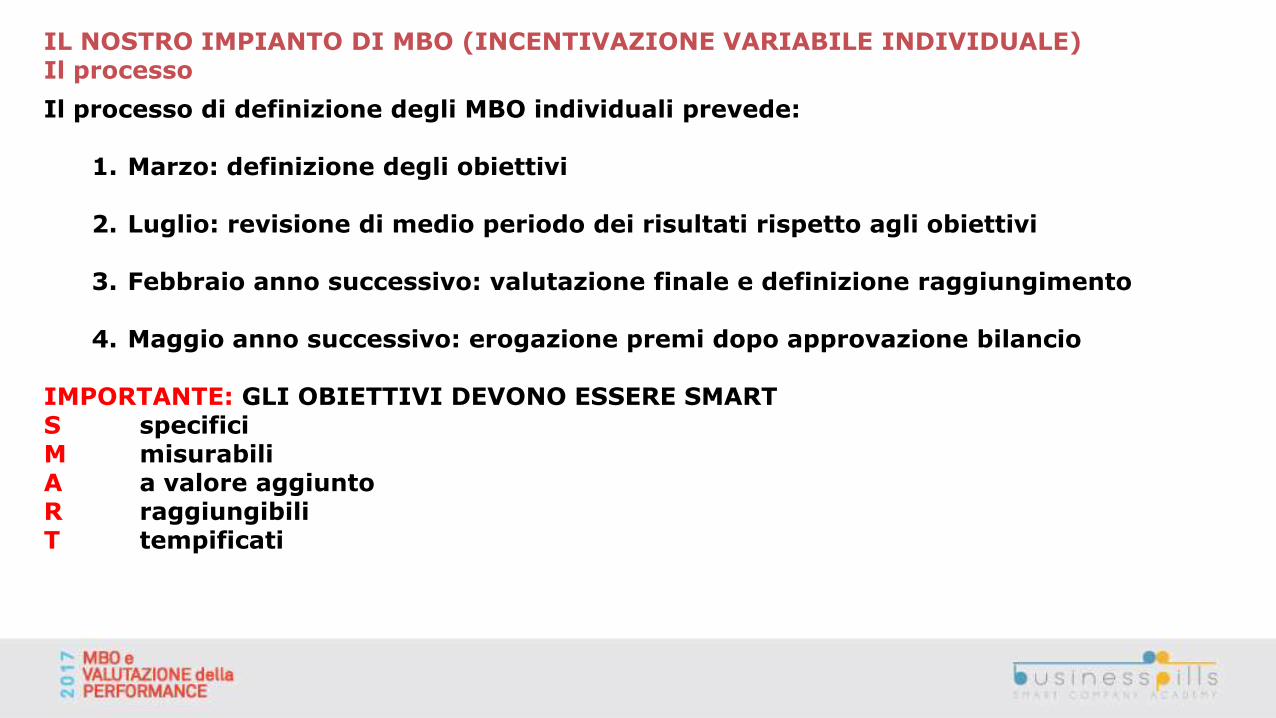
IL NOSTRO IMPIANTO DI MBO (INCENTIVAZIONE VARIABILE INDIVIDUALE) Il processo
Il processo di definizione degli MBO individuali prevede:
1. Marzo: definizione degli obiettivi
2. Luglio: revisione di medio periodo dei risultati rispetto agli obiettivi
3. Febbraio anno successivo: valutazione finale e definizione raggiungimento
4. Maggio anno successivo: erogazione premi dopo approvazione bilancio
IMPORTANTE: GLI OBIETTIVI DEVONO ESSERE SMART S specifici M misurabili A a valore aggiunto R raggiungibili T tempificati
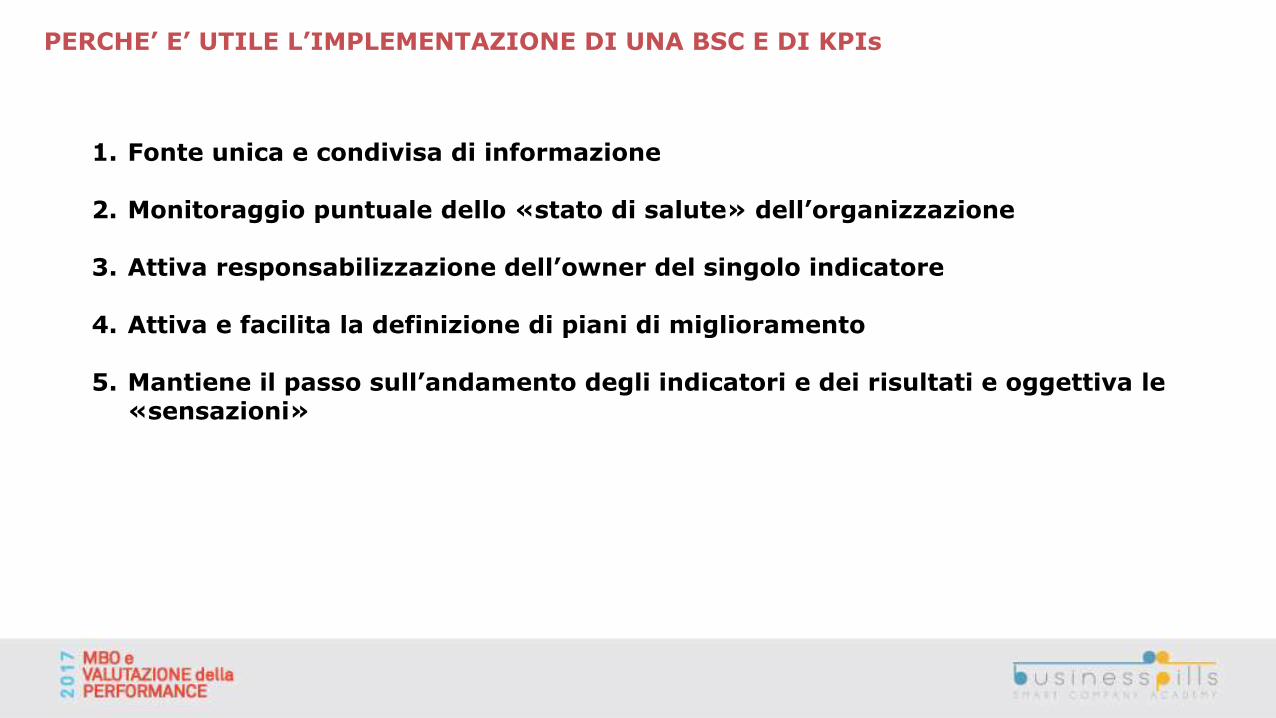
PERCHE’ E’ UTILE L’IMPLEMENTAZIONE DI UNA BSC E DI KPIs
1. Fonte unica e condivisa di informazione
2. Monitoraggio puntuale dello «stato di salute» dell’organizzazione
3. Attiva responsabilizzazione dell’owner del singolo indicatore
4. Attiva e facilita la definizione di piani di miglioramento
5. Mantiene il passo sull’andamento degli indicatori e dei risultati e oggettiva le «sensazioni»
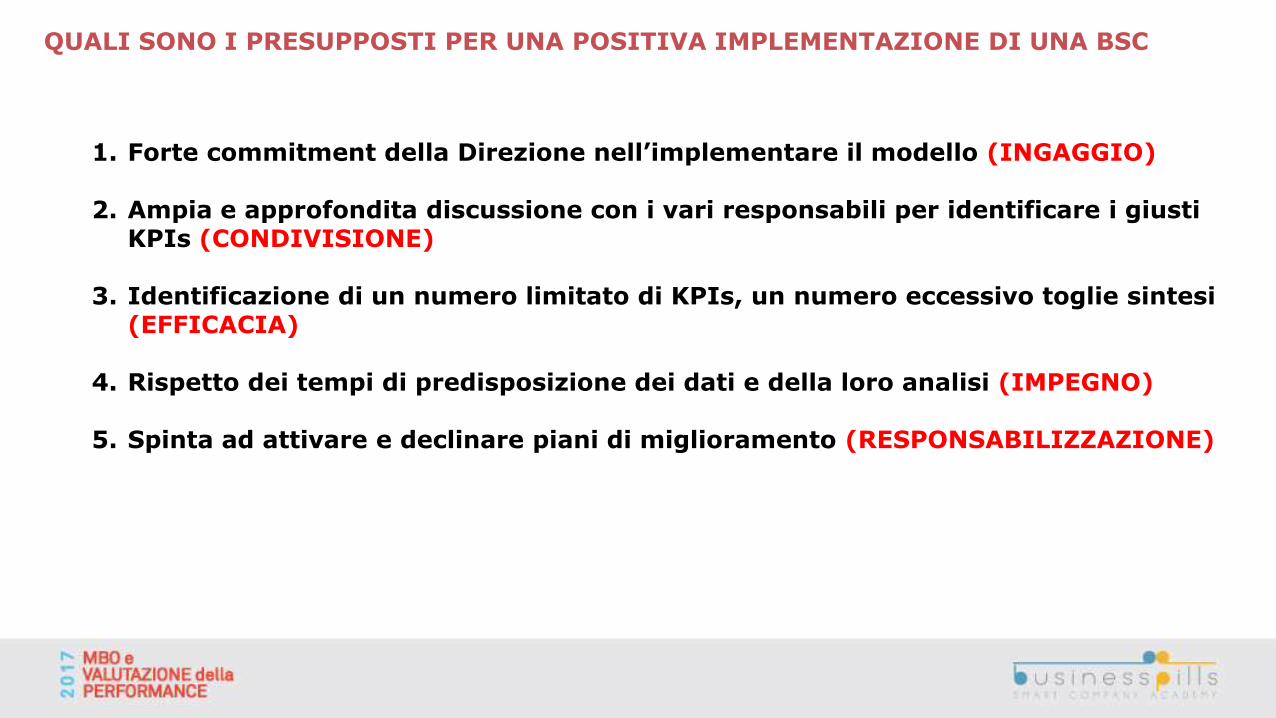
QUALI SONO I PRESUPPOSTI PER UNA POSITIVA IMPLEMENTAZIONE DI UNA BSC
1. Forte commitment della Direzione nell’implementare il modello (INGAGGIO)
2. Ampia e approfondita discussione con i vari responsabili per identificare i giusti KPIs (CONDIVISIONE)
3. Identificazione di un numero limitato di KPIs, un numero eccessivo toglie sintesi (EFFICACIA)
4. Rispetto dei tempi di predisposizione dei dati e della loro analisi (IMPEGNO)
5. Spinta ad attivare e declinare piani di miglioramento (RESPONSABILIZZAZIONE)